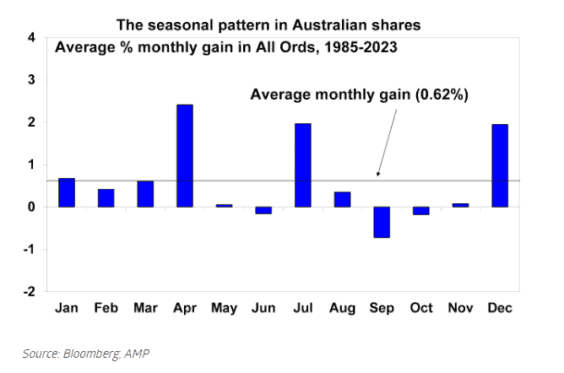
April, July and December have tended to be the strongest months of the year for price growth among ASX shares, according to analysis by AMP.
Since 1985, Australian share price gains have averaged 2.4% in April, 2% in July, and 1.9% in December.
This compares to an average monthly gain for all months of 0.62%.
September is typically the weakest month for ASX shares, according to the analysis.
In a blog published on asx.com.au, AMP chief economist Dr Shane Oliver explains that share market seasonality is due to ebbs and flows in demand for ASX shares at different times of the year.
The typical pattern is for ASX shares to strengthen from about October or November through to July the following year, followed by weakness through to September.
Relative weakness is often seen in May and June, which AMP interprets as representative of tax-loss selling.
That's when investors sell poor-performing ASX shares before the end of the financial year so they can offset those capital losses against any capital gains made in the same financial year.
Do ASX shares follow the same pattern as US shares?
Dr Oliver says ASX shares perform in similar patterns to US shares.
Here is a chart documenting share price movements for ASX All Ords shares per month since 1985.

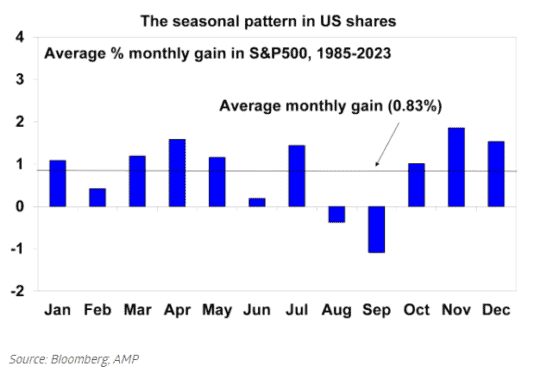
Here is the same information pertaining to S&P 500 Index (SP: .INX) shares in the US.

US share markets have historically been relatively weak around the September quarter, which is when the financial year finishes. So, this is when US investors would be doing most of their tax-loss selling.
Investors then start buying back into the market in the last quarter of the year.
There is a phenomenon called the 'January effect', when US shares have historically performed well on the back of new year optimism and a tendency for executives to invest their bonuses in more US stocks.
In recent years, anticipation of the 'January effect' has brought buying momentum forward to November and December.
US stocks tend to perform well between January and May, by which time new year optimism has faded.
Since 1985, November and April have been the strongest months for US shares, with average monthly gains of 1.9% and 1.6% respectively, according to AMP's analysis.
This compares to an average monthly gain across all months of 0.83%.
August and September have historically been the weakest months for US shares.
Is 'sell in May and go away' still relevant in 2024?
Since 1985, the average total return (i.e, price rises and dividends) from US shares from the end of November to the end of May has been 90% higher than the return from the end of May to the end of November.
Globally, and in Australia and Asia, it has been three or more times bigger, according to AMP's analysis.
Which ASX shares gained the most value in April?
As we said earlier, April tends to be a strong month for ASX shares, but not this year.
The S&P/ASX 200 Index (ASX: XJO) fell by 3% last month due to fears of delayed interest rate cuts.
But some ASX shares made spectacular gains.
Below are the top five risers of the month, according to CommSec data.
| ASX 200 share | Share price growth in April |
| Emerald Resources NL (ASX: EMR) | 20.8% |
| South32 Ltd (ASX: S32) | 19.7% |
| Newmont Corporation (ASX: NEM) | 18.6% |
| RED 5 Limited (ASX: RED) | 18.4% |
| Silver Lake Resources Ltd (ASX: SLR) | 17.7% |
Foolish takeaway
Dr Oliver says "it's not always reliable, but don't ignore the time of the year".
He says:
Seasonal influences can also be overwhelmed when contrary fundamental influences [such as market or company factors] are strong, so they don't apply in all years.
Seasonal patterns certainly shouldn't dominate an investor's strategy.
However, they nevertheless provide a reasonable guide to the monthly rhythm of markets that investors should ideally be aware of.


