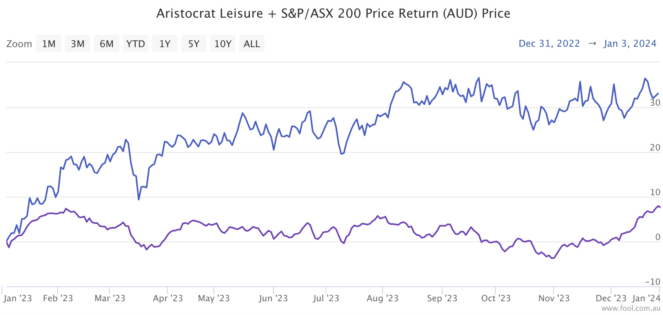
The S&P/ASX 200 Index (ASX: XJO) ascended 7.8% in 2023, just shy of the benchmark's average historical return of 9.3%. Much of this return can be attributed to the top 20 ASX shares inside the 200-strong index due to their prominent weighting.
Australia's largest 20 companies by market capitalisation constitute roughly 63% of the benchmark index. As such, the performance of our pre-eminent equity yardstick tends to reflect the summation of these behemoths.
But what if an investor didn't want a proxy for passive investing?
Not all Aussie stocks move in unison with each other and the index. We can quantify this by assessing the correlation between ASX shares and the ASX 200.
Why be different?
Let's be clear: there is nothing wrong with taking the market average. Investing in 'the market' has been a fruitful approach for many, approximately generating a 175% return (before dividends) over the last 25 years.
However, for some, the passive way does not suffice. Those who choose to pick stocks actively aspire to beat the market.
It's a challenging undertaking but not impossible. Famed stockpicker Warren Buffett has posted a 20% annualised return during his tenure at Berkshire Hathaway Inc (NYSE: BRK.A) (NYSE: BRK) — doubling the market. To achieve this, a portfolio needs to look different to the market it's aiming to outperform.
One way to analyse whether an ASX share has mirrored the index in the past or not is through calculating the correlation. It won't determine the future because it's a backward-looking measurement. However, it can help to form a view of the company's tendency to depart from its peers.
Correlation is a statistical calculation, outputting a value between -1 and 1. An ASX share is more similar to the index the closer to 1 it is. A value of negative 1 indicates a stock price that moves proportionally opposite to the benchmark. Lastly, zero means there is no evident correlation — neither inverse nor otherwise — between the two.
Big name ASX share marching to the beat of its own drum
Some may venture into small-cap stocks to find uncorrelated assets to the benchmark. Yet, based on 2023 data, there might be differentiated investments inside even the top 20 Australian companies housed in the S&P/ASX 20 Index (ASX: XTL).
| ASX-listed company | Price change | Correlation |
| Aristocrat Leisure Limited (ASX: ALL) | 33.7% | -0.075 |
| Santos Ltd (ASX: STO) | 6.4% | 0.047 |
| Woodside Energy Group Ltd (ASX: WDS) | -12.1% | 0.054 |
| Newmont Corporation CDI (ASX: NEM) | 2.1% | 0.104 |
| Woolworths Group Ltd (ASX: WOW) | 12.4% | 0.146 |
After running the numbers, we can see the most uncorrelated ASX share among the top 20 was Aristocrat Leisure. The $26 billion gaming machines and technology company had a -0.075 correlation, denoting no evident relationship to the benchmark index.
Beating out the ASX 200 by nearly 26%, Aristocrat Leisure had a year worth celebrating in 2023. For the 12 months ending 30 September 2023, the company grew its net profit after tax (NPAT) by 53.3% to $1.454 billion.

The difference in weekly price changes between Aristocrat Leisure and the ASX 200 drives the uncorrelated outcome. As shown above, the gaming company's share price does not consistently follow or invert the market's move week-to-week.
Word of warning
Like all analysis tools, they are best used in conjunction with others. A weak or inverse correlation is not single-handedly a 'buy' indicator. Instead, its utility is in helping establish potential portfolio risk — for example, a high correlation within a portfolio of shares.
Furthermore, as they teach in school, correlation does not imply causation. More than likely, the correlation, or lack thereof, is merely happenstance… a coincidence. You might find last year's least correlated ASX share is this year's most.


