For the first time since 2018, the S&P 500 Index (SP: .INX) has gone 100 days without a daily drop any higher than 1.5%.
The S&P 500 represents the 500 largest companies listed on the New York Stock Exchange.
It's considered the benchmark for US shares, much like the S&P/ASX 200 Index (ASX: XJO) is seen as the benchmark for Australian shares.
According to Bloomberg, the S&P 500 has recorded only four trading days with losses exceeding 1% in the two months since its 2023 peak in late July.
Commentators say this demonstrates resilience, despite the current macroeconomic global challenges of higher inflation and interest rates.
What's driving this resilience?
People are feeling relieved that inflation is falling, which means rate hikes will likely end soon.
This is occurring in both the US and Australia.
The US Federal Reserve has raised benchmark rates to their highest level in more than two decades.
The Reserve Bank of Australia has raised our cash rate to 4.1%, the highest point since 2012.
A Globalt Investments senior portfolio manager, Thomas Martin, said:
It's unusual, but there haven't been reasons for big drops in the stock market.
Unless the Fed really surprises investors this week, there isn't going to be a reason to reposition because we know rate hikes are nearly done.
The US Fed's next rate decision will come on Wednesday US time. Economists surveyed by Bloomberg anticipate rates will be held at their current level, with possibly one more increase to come in 2023.
In Australia, the RBA has held rates steady for three consecutive months. The RBA's next meeting will be on Tuesday 3 October, led by newly installed RBA Governor Michele Bullock.
What's next for the S&P 500 and ASX 200?
As we reported, US shares officially entered a new bull market back in June.
At that point, US shares had lifted by more than 20% from their October 2022 trough, which is the definition of a bull run.
The Dow Jones Industrial Average Index (DJX: .DJI) began a new bull run in November 2022.
The Nasdaq Composite Index (NASDAQ: .IXIC) did the same in May 2023.
The S&P 500 has always stayed in the green if it's up 7% or higher on the 100th trading day of the year, which was 25 May this year.
What does this mean for ASX 200 shares?
ASX shares routinely follow US shares.
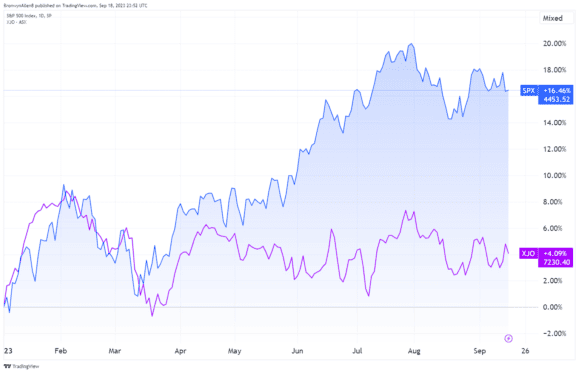
However, if we look at the year-to-date performance of the S&P 500 and the ASX 200, we can see a divergence that started in May.

The S&P 500 is up 16.46% in the year to date.
By comparison, the ASX 200 is up by just 4.09%.


